
The Dashboard Icon is an image of the speedometer. It is the most prominent top icon for a reason. It provides a quick punch of information. For Owner / Executives, it provides the financials in graphical form for the day / week / month / last several months. For employees on the Location Dashboard, it provides important guest information for the current day and the following day. If your dashboard is not appearing or not working, please reach out to customer service to have it turned on. If there is another graphical chart that you would like to be added or implemented on your dashboard that you believe other businesses would benefit from as well, please reach out to us with the details.
Some of the location metrics include: a. Today’s Order Count i. A real time pie chart breakdown of online orders and in store orders during the current day. b. Today’s Order Sales i. A real time pie chart breakdown of online sales and in store sales during the current day. c. Today’s Reservation Count i. A real time pie chart breakdown of online participant admissions and in store participant admissions during the current day. d. Monthly Sales Summary i. A bar chart that shows total sales by month for the past 9 months including a real time running total for the current month. e. Today’s Reservations i. A list of the reservations for the current day including the owner/organizer, number of guests, facility/activity, start time and order type - whether it was adeposit or paid in full.
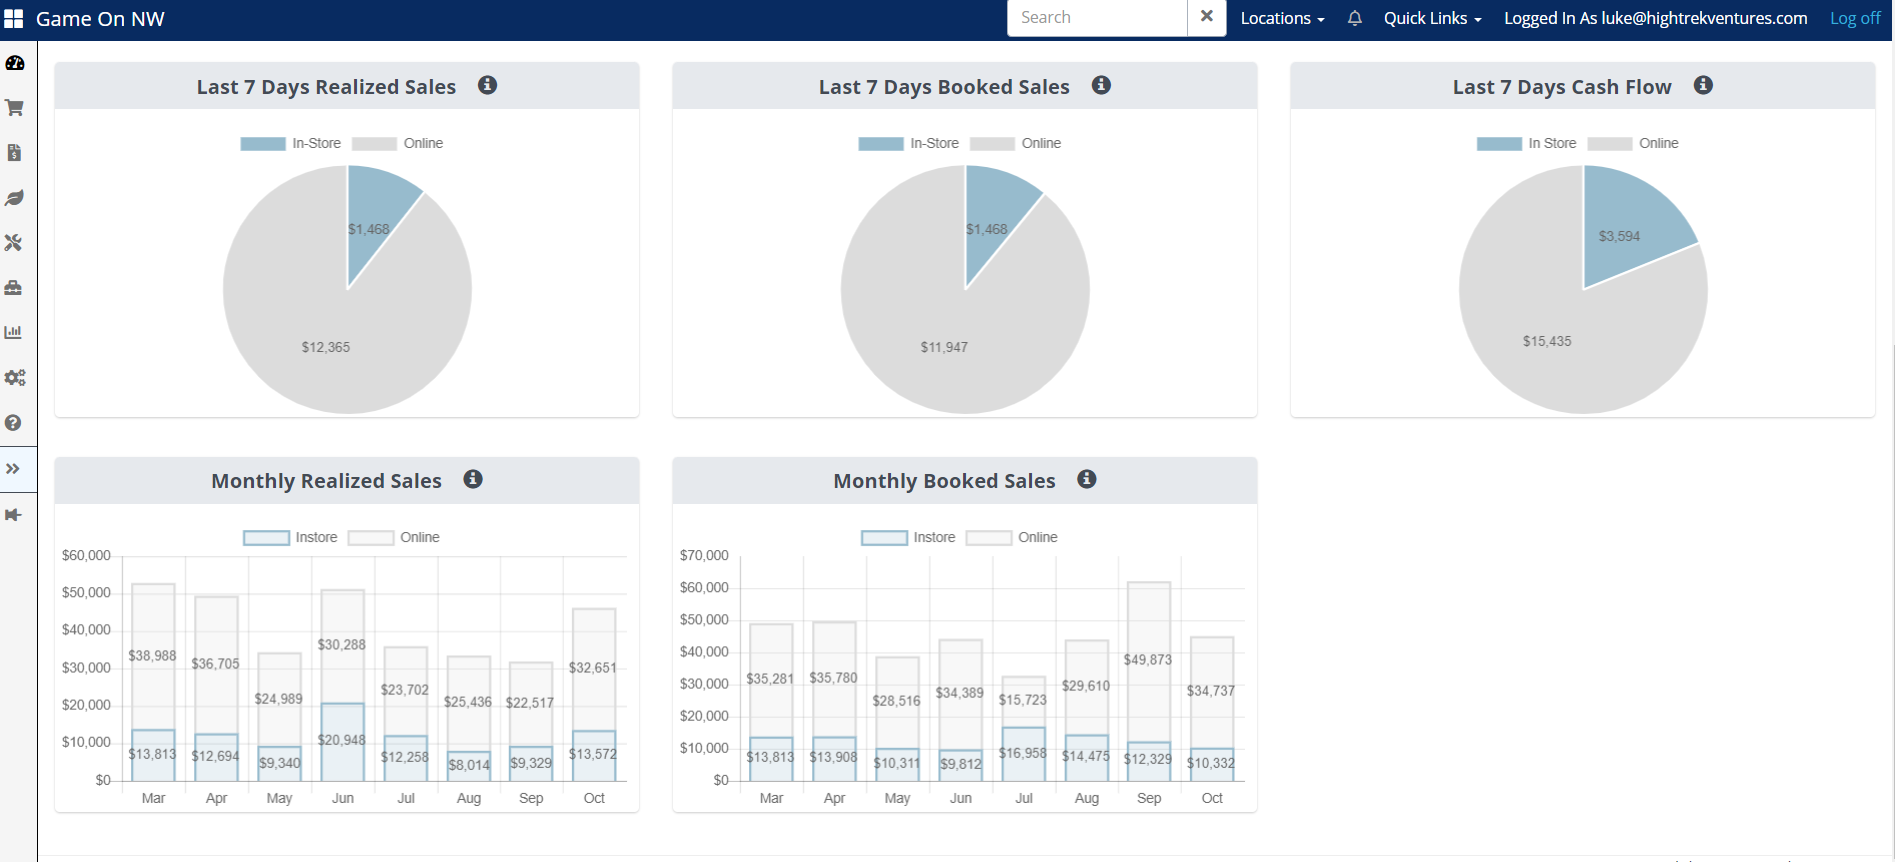
Some of the Executive level dashboards include realized sales, booked sales, and cash flow. It is important to understand the differences in these three.
a. Realized Sales - These are the sales that you have performed the service for. A sale may happen today, but it will not be realized until the day that the service is rendered.
b. Booked Sales - These represent the dollars of booked sales during the period, whether it be a day, week, or month. These sales may be booked for events that are several weeks out and will not be "realized" as described above until the event date. These booked measurements are a good indicator as to what time of the week or time of the day customers like to place orders. It also can give you an idea about how your realized sales will be trending in the days and weeks ahead.
c. Cash Flow - This is how much money you are actually taking in. Note, it doesn't just mean cash as in bills and coins, but all the money for that day including credit card, digital payments, and cash. Cash can come in for reservations that are far in the future. Or, if only a deposit is made, then the deposit portion of that order would count towards cash for the time period. When the balance of the order is collected, often on the day of the event, that balance collected will appear as cash flow on that day.
Some of the location metrics include: a. Today’s Order Count i. A real time pie chart breakdown of online orders and in store orders during the current day. b. Today’s Order Sales i. A real time pie chart breakdown of online sales and in store sales during the current day. c. Today’s Reservation Count i. A real time pie chart breakdown of online participant admissions and in store participant admissions during the current day. d. Monthly Sales Summary i. A bar chart that shows total sales by month for the past 9 months including a real time running total for the current month. e. Today’s Reservations i. A list of the reservations for the current day including the owner/organizer, number of guests, facility/activity, start time and order type - whether it was adeposit or paid in full.
Some of the Executive level dashboards include realized sales, booked sales, and cash flow. It is important to understand the differences in these three.
a. Realized Sales - These are the sales that you have performed the service for. A sale may happen today, but it will not be realized until the day that the service is rendered.
b. Booked Sales - These represent the dollars of booked sales during the period, whether it be a day, week, or month. These sales may be booked for events that are several weeks out and will not be "realized" as described above until the event date. These booked measurements are a good indicator as to what time of the week or time of the day customers like to place orders. It also can give you an idea about how your realized sales will be trending in the days and weeks ahead.
c. Cash Flow - This is how much money you are actually taking in. Note, it doesn't just mean cash as in bills and coins, but all the money for that day including credit card, digital payments, and cash. Cash can come in for reservations that are far in the future. Or, if only a deposit is made, then the deposit portion of that order would count towards cash for the time period. When the balance of the order is collected, often on the day of the event, that balance collected will appear as cash flow on that day.